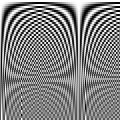
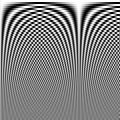
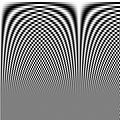
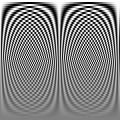
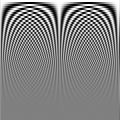
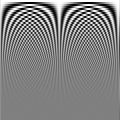
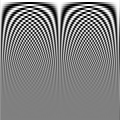
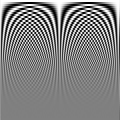
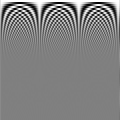
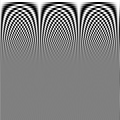
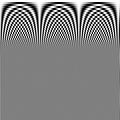
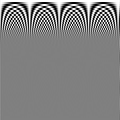
Comparison of Scaler Kernels in y4mscaler
Frequency Response
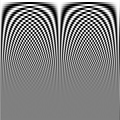
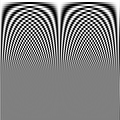
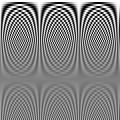
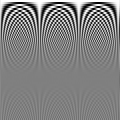
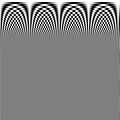
Here are the resulting scaled frames, which were measured to create the
frequency response graphs on the previous page.
Note that your monitor itself may interact with these images, producing
moire patterns and other aliasing effects.
For the most accurate results, view on
a large high physical-resolution screen, which is set to low pixel resolution
(i.e. big pixels on a high dot-pitch CRT). This chart is probably useless
when viewed on an LCD monitor.
| M/N |
box |
linear |
quadratic |
cubic |
cubicB |
cubicCR |
cubicK4 |
sinc:4 |
sinc:6 |
| 2/3 |
 |
 |
 |
 |
 |
 |
 |
 |
 |
| 1/2 |
 |
 |
 |
 |
 |
 |
 |
 |
 |
| 1/3 |
 |
 |
 |
 |
 |
 |
 |
 |
 |
| 1/4 |
 |
 |
 |
 |
 |
 |
 |
 |
 |
return to y4mscaler

|
maximum impact research
Digital Media Group
<dmg at mir.com>
|
Last modified: Sun Dec 11 14:55:29 EST 2005
|
©2003 Matthew Marjanovic.
This material may not be republished in any form
without express written consent of the author.